Page 121 - Numeracy
P. 121
GRAPHS
TARGET 15E
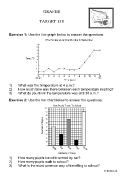
Exercise 1: Use the line graph below to answer the questions:
1) What was the temperature at 4 a.m.?
2) How much time was there between each temperature reading?
3) What do you think the temperature was at 9.30 a.m.?
Exercise 2: Use the bar chart below to answer the questions:
1) How many pupils travel to school by car?
2) How many pupils walk to school?
3) What is the most common way of travelling to school?
© SSER Ltd.