Page 119 - Numeracy
P. 119
GRAPHS
TARGET 15D - LINE GRAPHS
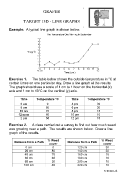
Example: A typical line graph is shown below:
Exercise 1. The table below shows the outside temperature in °C at
certain times on one particular day. Draw a line graph of the results.
The graph should use a scale of 1 cm to 1 hour on the horizontal (x)
axis and 1 cm to 10°C on the vertical (y) axis.
Time Temperature °C Time Temperature °C
6 am 0 4 pm 30
8 am 80 6 pm 20
10 am 70 8 pm 15
12 noon 60 10 pm 10
2 pm 50 12 pm 10
Exercise 2. A class carried out a survey to find out how much weed
was growing near a path. The results are shown below. Draw a line
graph of the results.
% Weed % Weed
Distance from a Path Distance from a Path
cover cover
0 cm 0 120 cm 30
20 cm 80 140 cm 20
40 cm 70 160 cm 15
60 cm 60 180 cm 10
80 cm 50 200 cm 10
100 cm 40 220 cm 10
© SSER Ltd.