Page 117 - Numeracy
P. 117
GRAPHS
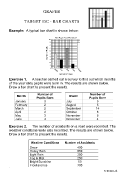
TARGET 15C - BAR CHARTS
Example: A typical bar chart is shown below:
Exercise 1. A teacher carried out a survey to find out which months
of the year sixty pupils were born in. The results are shown below.
Draw a bar chart to present the results.
Number of Number of
Month Month
Pupils Born Pupils Born
January 3 July 5
February 2 August 5
March 2 September 14
April 2 October 8
May 3 November 8
June 4 December 4
Exercise 2. The number of accidents on a road were recorded. The
weather conditions were also recorded. The results are shown below.
Draw a bar chart to present the results.
Weather Conditions Number of Accidents
Snow 400
Heavy Rain 650
Light Rain 250
Fog & Mist 250
Bright Sunshine 50
Frost and Ice 700
[
© SSER Ltd.