Page 118 - Numeracy
P. 118
GRAPHS TARGET 15
HOW TO DRAW BAR CHARTS
Example: This is a typical bar chart:
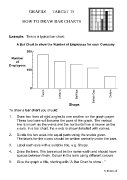
A Bar Chart to show the Number of Employees for each Company
200
Number
of
Employees
100
0
Tesco Iceland BeWise British Gas Oxfam
Shops
To draw a bar chart you should:
1. Draw two lines at right angles to one another on the graph paper.
These two lines will become the axes of the graph. The vertical
line is known as the y-axis and the horizontal line is known as the
x-axis. In a bar chart, the x-axis is shown labelled with names.
2. Divide the two axes into equal parts using the scales given.
The labels for the x-axis should be written centrally under the bars.
3. Label each axis with a suitable title, e.g. Shops.
4. Draw the bars. The bars must be the same width and should have
spaces between them. Colour in the bars using different colours.
5. Give the graph a title, starting with “A Bar Chart to show…”
© SSER Ltd.